Zabbix has served as a dependable infrastructure monitoring tool for years. However, today’s hybrid, cloud-native, and container-heavy environments require more agility, as modern teams need observability platforms that reduce inconveniences and integrate seamlessly. If you’re exploring options beyond Zabbix, this is for you.
In this guide, you’ll learn:
- Which 10 monitoring platforms are the most relevant Zabbix alternatives for infrastructure monitoring in 2025?
- How they compare in terms of deployment model, cloud and container support, alerting intelligence, and starting cost.
- Strengths, limitations, and migration complexity for each option so you can plan a safe switch.
The 10 Zabbix alternatives for infrastructure monitoring up front
- Prometheus + Grafana (self-hosted or Grafana Cloud)
- Datadog
- Dynatrace
- New Relic
- Splunk Observability Cloud
- Elastic Observability (Elastic Stack)
- LogicMonitor
- SolarWinds Observability
- Cisco AppDynamics
- Sensu
Comparison table of the 10 Zabbix alternatives for infrastructure monitoring
| Platform | Type | Starting price (example) | Best for | Key advantage |
| Prometheus + Grafana | Open-source / managed | Free self-hosted; Grafana Cloud from $19/mo | Cloud-native / Kubernetes | Query power (PromQL) + flexible dashboards. |
| Datadog | SaaS commercial | From $15 per host/mo (infra tier) | Fast SaaS rollout | Unified logs, metrics, traces; many integrations. |
| Dynatrace | SaaS commercial | Usage-hourly; infra tier $0.04/hr per host | Full-stack AIOps | Hourly usage model with AI-driven causality. |
| New Relic | SaaS commercial | Usage-based; free tier + paid per ingest/user | Teams wanting unified observability | Flexible, usage-based licensing |
| Splunk Observability | SaaS commercial | From $15 per host/mo (example infra tier) | Enterprise telemetry correlation | Strong log + metric correlation and enterprise SLAs. |
| Elastic Observability | Hybrid | Pay-as-you-go serverless options | Teams using ELK for logs + metrics | Unified agent and search-first analytics. |
| LogicMonitor | SaaS commercial | Contact sales; resource-based | Mid/large hybrid estates | Broad integrations and automated discovery |
| SolarWinds Observability | Hybrid/commercial | Module pricing; contact sales | On-prem + cloud hybrid | Familiar enterprise feature set and modules |
| AppDynamics | Commercial | CPU-core or unit pricing | Application-centric infra | Deep APM integration with infrastructure context |
| Sensu | Open-source/commercial | Free OSS up to specific nodes; paid enterprise | Custom pipelines and event-driven monitoring | Lightweight pipeline model for events and checks |
How we chose these Zabbix alternatives
Each tool on this list was measured against a clear set of criteria to ensure it could deliver value without adding unnecessary complexity.
The selection criteria included:
- Telemetry coverage: Tools had to capture core infrastructure signals—metrics, events, logs, and traces—across hosts, VMs, containers, storage, and networking layers.
- Cloud-native readiness: Native Kubernetes discovery, automated scraping, and support for OpenTelemetry were prioritized for modern environments.
- Operational overhead: Preference went to solutions that minimize management effort, whether through SaaS delivery, managed backends, or lightweight agents.
- Alerting intelligence: Features like deduplication, correlation, anomaly detection, and seamless integration with on-call workflows were essential.
- Migration ease: Tools were evaluated on how easily they can run in parallel with Zabbix and whether existing templates, alerts, and dashboards can be ported over.
- Cost and scalability: Both open-source economics and transparent SaaS pricing were considered to avoid surprises as the environment grows.
- Ecosystem strength: Availability of exporters, vendor integrations, and reliable community or commercial support also played a role.
1) Prometheus + Grafana
Best for cloud-native metrics and custom queries
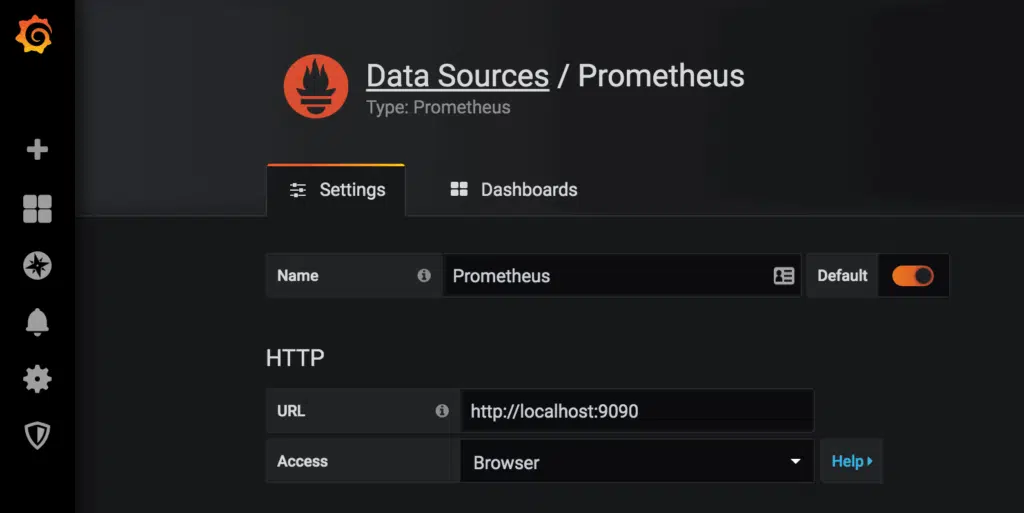
Prometheus is the de facto time-series engine for containerized environments. It scrapes instrumented endpoints, supports service discovery within Kubernetes, and exposes a powerful query language, PromQL, which allows you to build fine-grained alerts and SLO calculations. Grafana provides the visualization layer, and Grafana Cloud or a self-hosted Grafana stack offers hosted metrics, logs, and traces.
For infrastructure monitoring, Prometheus excels at high-resolution metrics and ad hoc analysis. Use node exporters, kube-state-metrics, and a catalog of exporters to cover hosts, storage, and standard services. Long-term retention and multi-tenancy often rely on remote write-backends or managed offerings. The Grafana layer gives you a dashboard builder, templated panels, and alert routing via integrations.
Migration notes: Running Prometheus alongside Zabbix is a low-risk approach — start by scraping the same hosts and comparing alert fidelity. Expect moderate ops work for durable storage and scale. Teams that already use Kubernetes will see immediate value; traditional datacenter teams will need to introduce exporters and retention backends.
Pros
- Industry-standard for metrics and Kubernetes.
- Extremely flexible queries and alerting rules.
Cons
- Long-term storage and multi-tenancy require extra components.
- Not a unified logs/traces platform on its own.
2) Datadog
Best for quick SaaS adoption and unified telemetry
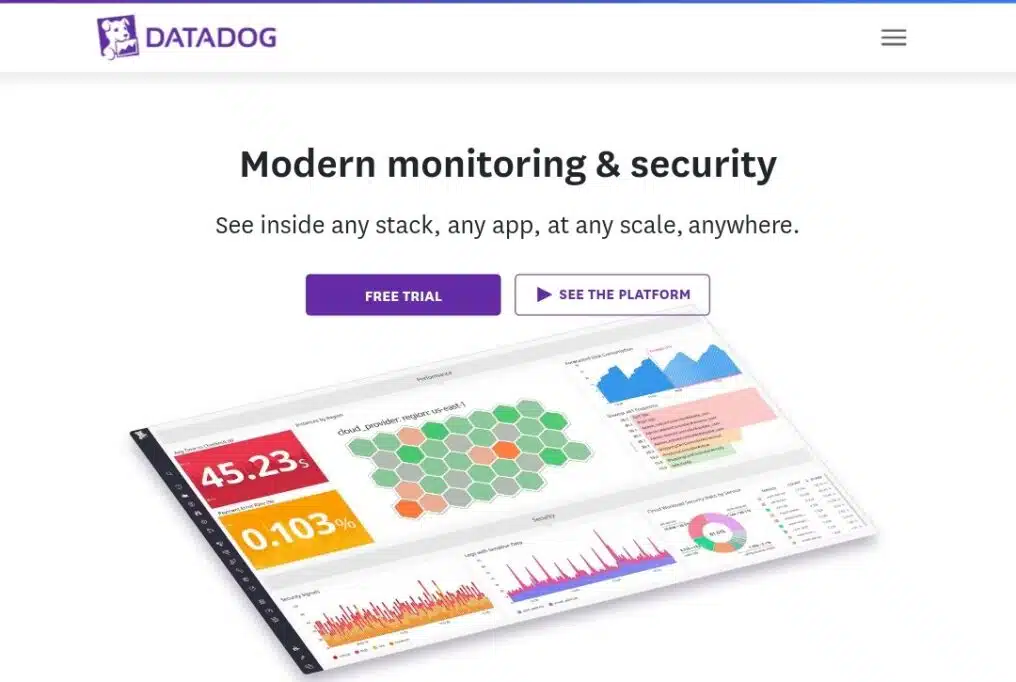
Datadog is a commercial SaaS observability platform that integrates infrastructure metrics, logs, traces, synthetics, and network telemetry under a single agent and UI. It offers broad integrations with cloud providers, orchestration platforms, and third-party services, along with managed dashboards and out-of-the-box monitors that reduce initial setup time. Datadog’s host-based infrastructure tier is commonly used by teams who want fast coverage and minimal backend maintenance.
Operationally, Datadog centralizes telemetry in the cloud, which removes the burden of running DBs and collectors. Alerts can leverage anomaly detection and composite monitors to reduce noise. The trade-off is the complexity of usage-based pricing: hosts, custom metrics, logs, and APM are modular, so costs can grow if ephemeral resources are not managed explicitly.
Migration is straightforward: Install the Datadog agent on a sample set of hosts and configure tagging to mirror Zabbix templates. Evaluate alert parity over a two-week parallel run and use Datadog’s export/import helpers where available. Teams with constrained budgets should model retention and ephemeral host behavior before full rollout.
Pros
- Rapid deployment and a wide integration surface.
- Unified view across logs, metrics, and traces.
Cons
- Cost can escalate with large amounts of data and ephemeral hosts.
- The SaaS model relies on trust in vendors and stable internet connectivity.
3) Dynatrace
Best for AI-Driven Root Cause Analysis at Scale

Dynatrace is a full-stack observability and AIOps platform built for complex, distributed environments. It automatically detects infrastructure components, maps dependencies, and applies distributed tracing. Its usage-based pricing with hourly billing for infrastructure and pod monitoring can suit organizations with highly elastic workloads. A key strength is its AI engine, which correlates events and identifies likely root causes to reduce alert noise and shorten incident response times.
For infrastructure teams, Dynatrace offers deep visibility into containers, VMs, and cloud services, along with automated baselining to detect performance anomalies. It minimizes manual setup by auto-instrumenting hosts and services, while still providing detailed health and capacity insights that make scaling more predictable.
Migration tip: Start by monitoring a smaller subset of your environment with Dynatrace. Compare the alerts, dashboards, and insights against what you currently see in Zabbix. Once validated, you can gradually expand coverage without adding heavy operational overhead.
Pros
- Strong automated discovery and causal analysis
- Usage-based pricing that fits cloud elasticity
Cons
- Costs can escalate at a sustained scale
- AI decisions can feel like a “black box” without explanation
4) New Relic
Best for Usage-Based Flexibility and Unified Platform
New Relic delivers full-stack observability with a usage-based pricing model that no longer depends strictly on host counts. Instead, you pay based on data ingestion and compute usage, which makes it flexible for teams with fluctuating workloads. The platform integrates metrics, logs, and traces into a single UI, making it easier for DevOps and SRE teams to work from the same data.
For infrastructure monitoring, New Relic provides host auto-instrumentation, built-in Kubernetes integrations, customizable dashboards, and a query language for analyzing telemetry. This makes it easier to monitor everything from VMs to cloud-native services under one platform.
Migration tip: Begin by onboarding a representative group of services into New Relic. Monitor ingestion volumes, retention needs, and alert behavior to model future costs before expanding to your whole environment. This step helps prevent surprises and ensures pricing stays under control.
Pros
- Flexible billing and strong developer tooling
- Unified observability experience across infrastructure and applications
Cons
- Data ingestion costs can spike unexpectedly
- Requires strict governance to manage retention and prevent overages
5) Splunk Observability Cloud
Best for enterprise log + metric correlation
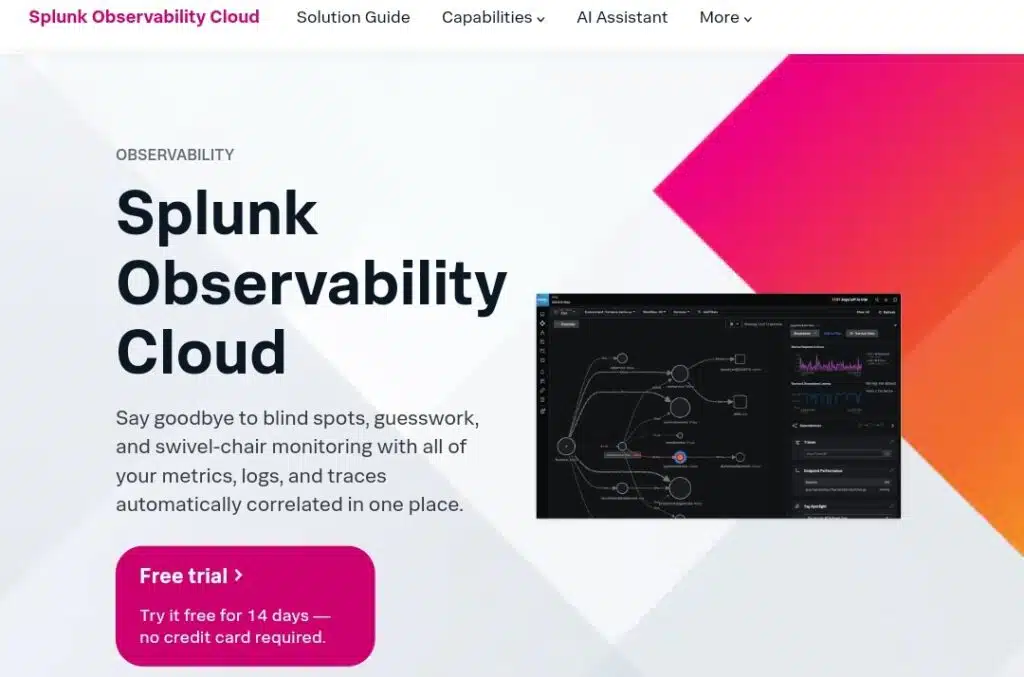
Splunk Observability Cloud focuses on high-cardinality metrics, logs, and traces with strong enterprise-grade features for security, compliance, and SLA reporting. It integrates with Splunk’s search-first heritage to allow deep forensic queries across telemetry and business events. For infrastructure teams, Splunk provides a tight correlation between logs and metric anomalies, accelerating incident response.
Operationally, Splunk’s cloud product collects via agents and ingestion pipelines and provides dashboards and alerting. It is often chosen by teams that already run Splunk for security or logging and want a single vendor for observability and SIEM capabilities.
Migration notes: Splunk is well-suited for large enterprises with strict compliance requirements. Migration requires mapping log formats, adjusting ingestion pipelines, and re-creating alert logic. Expect a higher initial cost and engineering for ingestion, but a strong ROI in environments where correlated telemetry and audits are required.
Pros
- Excellent log-to-metric correlation and search capabilities.
- Enterprise features for compliance and SLAs.
Cons
- Potentially expensive ingestion costs.
- Requires planning for the index and retention strategy.
6) Elastic Observability (ELK)
Best for teams that want search-first observability

Elastic offers logs, metrics, and traces via a unified agent and the Elastic Stack. Teams that already use Elasticsearch for search and logging find Elastic Observability appealing because it consolidates ingestion, retention, and analytics in one system. Elastic’s serverless observability options enable teams to pay for what they use while maintaining a consistent stack.
For infrastructure monitoring, Elastic supports agents for hosts and containers, ingest pipelines for logs, and metric collection via Metricbeat. Dashboards are highly customizable. The open-source roots mean you can self-host or run Elastic Cloud for managed storage and scaling.
Migration path: Ingest a sample of your logs and metrics and run queries side-by-side with Zabbix alerts. If long-term retention and searchable logs are essential, Elastic gives you both. Be aware that Elasticsearch tuning and index management remain an operational responsibility unless you are using the managed service.
Pros
- Unified, search-first analytics across logs and metrics.
- Flexible self-hosted or managed deployment models.
Cons
- Self-hosting requires careful management of indexes and clusters.
- Pricing and sizing can be tricky without managed service.
7) LogicMonitor
Best for a broad hybrid infrastructure with rapid discovery
LogicMonitor is a SaaS platform designed to automatically discover, monitor, and map hybrid infrastructure. It covers cloud instances, on-prem servers, network devices, storage, and SaaS services with an extensive integration library. LogicMonitor emphasizes low-effort onboarding and AI-assisted anomaly detection, which appeals to teams that need broad coverage without intensive setup.
Operations teams benefit from agentless discovery for many devices, an extensible collector model for demanding environments, and prebuilt dashboards for standard technology stacks. The platform’s resource-based pricing can be predictable for planning purposes, but often requires vendor engagement to obtain precise quotes.
Migration approach: Enable LogicMonitor collectors in non-production segments, verify discovery and mapping quality, then progressively add monitoring policies. Expect a shorter ramp for discovery and dashboarding compared with hand-crafted Zabbix templates.
Pros
- Fast discovery and strong hybrid coverage.
- Effective automation and anomaly detection for mid-to-large enterprises.
Cons
- Pricing requires sales engagement and can be higher than OSS stacks.
- Less suitable for teams that need deep query-level customization.
8) SolarWinds observability
Best for enterprise module-based monitoring
SolarWinds offers modular observability with familiar components for server, application, and network monitoring. It is often chosen by large enterprises that want granular control, long-term vendor relationships, and a menu of Orion modules to expand capabilities gradually. SolarWinds offers both on-premises and SaaS options, which are particularly beneficial in highly regulated contexts.
Operationally, SolarWinds integrates collectors, probes, and device-based monitoring with mapping and dependency visualization. Its module pricing offers flexibility, but makes cost modeling crucial as the estate expands.
Migration notes: SolarWinds is a good fit if the organization already uses other SolarWinds modules or needs an on-prem option with enterprise SLAs. Migrating involves mapping Zabbix templates and rebuilding dashboards with SolarWinds modules.
Pros
- Modular options and strong enterprise support.
- On-premises options for regulated environments.
Cons
- Complexity and module-driven pricing.
- Setup and tuning can be time-consuming.
9) Cisco AppDynamics
Best where application performance needs a tight infra context
AppDynamics focuses on application performance monitoring, with a solid infrastructure foundation. It ties application code performance to host and process health, offering deep transaction visibility and business-impact views. For teams whose infrastructure monitoring must link tightly to application performance and business metrics, AppDynamics delivers correlated diagnostics and service maps.
From an operational perspective, AppDynamics instruments applications, collects metrics from hosts and containers, and offers root-cause analysis workflows to guide remediation. Licensing often follows CPU-core or unit-based models, so teams should estimate the number of cores when planning costs.
Migration can be staged: Instrument a few services to evaluate transaction tracing and then expand host coverage. AppDynamics is valuable when application latency and customer-impact metrics are central to incident response.
Pros
- Deep APM + infrastructure correlation.
- Strong business transaction modelling.
Cons
- Licensing by core or units can be expensive at scale.
- Best value requires broad instrumentation.
10) Sensu
Best for Event-Driven, Check-Based Infrastructure Pipelines
Sensu is designed around an event-driven monitoring model. Instead of focusing only on hosts or metrics, it provides a flexible event pipeline that collects checks, processes them through agents, and routes results to alerts or automation workflows. This makes it well-suited for teams that want fine-grained control and the ability to build custom workflows for remediation, enrichment, and notifications. Sensu is available both as a free open-source project and as a commercial version with enterprise support.
Its lightweight agents and pipeline-first architecture enable you to centralize checks, handle noisy or “flapping” alerts more intelligently, and integrate seamlessly with external systems, such as Prometheus exporters or third-party metrics backends. Sensu shines when you need automation — for example, triggering scripts or workflows to resolve recurring operational issues without manual intervention.
Migration tip: You can gradually transition from Zabbix by replacing specific checks with Sensu while continuing to route alerts through your existing incident systems. Over time, you’ll gain more flexibility to adopt Sensu’s composable, code-driven monitoring approach, which pairs naturally with infrastructure-as-code practices.
Pros
- Flexible event pipeline with strong automation capabilities
- Open-source option keeps entry costs low
Cons
- Requires more design and engineering effort up front
- Limited built-in dashboards compared to SaaS competitors
Final takeaways
- Each Zabbix alternative on this list offers stronger cloud-native capabilities, including Kubernetes auto-discovery, unified metrics, logs, and traces.
- Match the tool to the team and the budget. Open-source stacks offer control at a low cost, while SaaS platforms eliminate operational overhead and scale quickly; therefore, the right choice depends on your environment and resources.
So,
Zabbix remains a capable platform, but the monitoring needs of 2025 demand more.
The alternatives in this list—ranging from Prometheus + Grafana to AppDynamics and Sensu—show there’s no one-size-fits-all. Some emphasize cloud-native scalability, others focus on enterprise compliance, and some deliver pipeline-first flexibility.
Your best choice depends on your needs:
Heavy Kubernetes? Look at Prometheus, Datadog, or Dynatrace.
Hybrid enterprise? SolarWinds or LogicMonitor may fit best.
Deep APM ties? AppDynamics leads.
The next step isn’t to rip out Zabbix overnight. Instead, pilot two alternatives in parallel, measure alert quality, and test migration paths to determine the most effective approach.

