The proper monitoring tool can make or break your workflow when managing networks.
Zabbix is an open-source monitoring platform renowned for its flexibility, scalability, and robust alerting capabilities. It’s trusted by many IT teams for tracking network health, servers, and applications in real time. Though popular, it’s not the only option, and sometimes, exploring alternatives can unlock features you didn’t know you needed.
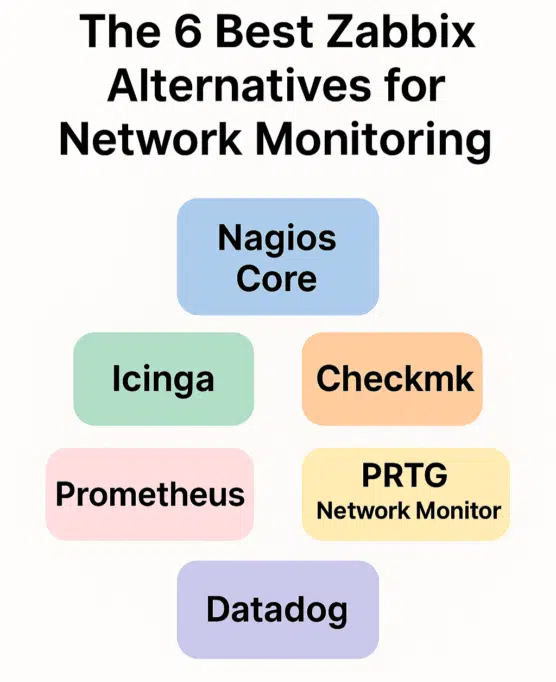
I’ll share the 6 best Zabbix alternatives I reviewed in this guide. Each one offers a distinct approach to network monitoring that will suit your IT networking goals.
However, let’s examine why I had to look for alternatives and the key features they offer.
Why I looked for Zabbix alternatives
Zabbix checked many boxes for me, but over time, I realized it demanded more skill, time, and maintenance than I could keep up with. Those trade-offs are acceptable for large teams, but they started slowing me down as a one-person operation. Here’s why I decided to look elsewhere.
First, the learning curve was heavier than I expected. Getting everything in place meant setting up I agents, building templates, defining discovery rules, configuring triggers, assigning user roles, and sizing the database correctly. None of these tasks was impossible, but together they stretched out the rollout far longer than I wanted.
Second, the web UI felt dated. Customizing dashboards for specific roles, drilling into root causes, or filtering alerts required too many clicks compared to more modern platforms.
Third, scaling introduced new overhead. Planning proxy placement, managing history and trend retention, and routine housekeeping added ongoing tasks as my environment grew.
Fourth, integrations weren’t as seamless as I’d hoped. Kubernetes, serverless, and cloud-native services were doable, but often needed community add-ons rather than native connectors.
Fifth, support was another concern. The community is strong and has commercial plans, but I wanted faster, hands-on help or a fully managed option to reduce the operational burden.
Finally, cost wasn’t just about licenses. Zabbix is open-source, but real expenses like engineering time, hardware, and maintenance doubled.
Ultimately, I sought a monitoring solution that was easier to set up, more scalable, and less time-consuming. That’s what led me to search for alternatives.
On the other hand, if you invested in Zabbix expertise and enjoy customization, staying the course is reasonable. The point is to align the monitoring model with your people, pace, and platform choices.
Key features to look for in a Zabbix alternative
Choosing a replacement is easier when you define non-negotiables up front. These are the criteria I use to evaluate Zabbix alternatives and avoid costly rework later.
Ease of setup and operations: Prefer tools that auto-discover devices and services, ship sensible defaults, and minimize manual templating. Clear install paths (packages, containers, SaaS) and guided setup shorten time to value.
Scalability and performance: Look for horizontal scale, distributed collectors, efficient storage, and tunable retention. The system should handle bursty telemetry without dropped data or alert lag.
Coverage breadth: Verify support for SNMP, flow data, ICMP, agents, APIs, cloud services, containers, and applications. Fewer bolt-ons means fewer blind spots.
Alerting quality: Good monitors do more than send emails. You want multi-channel notifications, deduplication, correlations, maintenance windows, and escalation policies that reflect how your team works.
Dashboards and reporting: Role-based views for NOC, SRE, network, and leadership keep everyone aligned. Historical reporting, capacity trends, and SLA views help with planning and accountability.
Extensibility and integrations: Strong REST APIs, webhooks, and native integrations with ticketing, chat, CI/CD, and secrets managers reduce glue code and speed workflows.
Security and compliance: Encryption in transit, granular RBAC, SSO, audit logs, and data residency options matter in regulated environments.
Cost and licensing clarity: Free is not free if it consumes scarce engineering time. Understand how pricing scales (by host, sensor, metric, user, or volume) and model realistic growth.
Support model: Consider the value of vendor support, training, and a managed option. Even experienced teams benefit from a safety net during incidents and upgrades.
These fundamentals will help you make your choice and result in good outcomes. Pick the solution that satisfies today’s requirements while leaving room to grow without painful migrations later.
The 6 best Zabbix alternatives for network monitoring
Nagios Core
Why it’s a good alternative
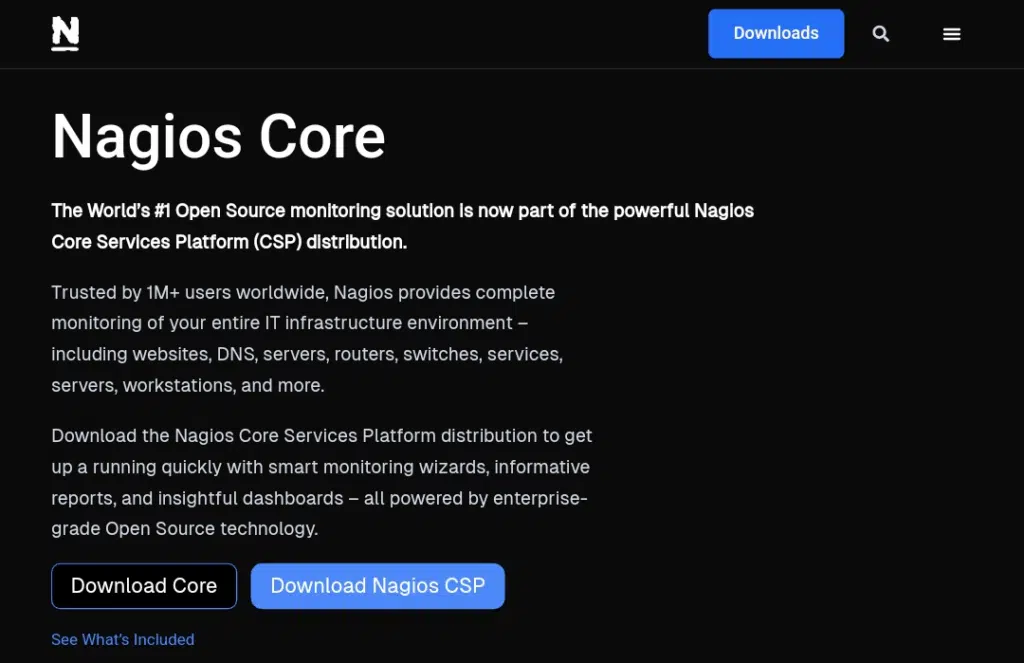
Nagios Core is a veteran in infrastructure monitoring. It matches Zabbix’s flexibility through a plugin-driven model and a simple check philosophy: run a command, parse the result, and alert on thresholds. That makes it ideal for tailored environments where teams want explicit control over what is measured and how alerts fire.
Key features
- Thousands of community and official plugins covering hosts, services, and network gear
- Agentless checks via SNMP, SSH, and HTTP, plus lightweight agents where needed
- Event handlers for automated remediation and custom workflows
- Distributed monitoring with pollers for scale and fault isolation
Pros
- Open-source, battle-tested, and very extensible
- Transparent operation; every check is easy to reason about
- Huge ecosystem of checks, guides, and examples
Cons
- Manual configuration can be time-consuming at scale
- Web UI is functional but dated compared to modern SaaS tools
Pricing
Nagios Core is free. If you want a commercial path, Nagios XI offers wizards, reports, and an enhanced UI under a perpetual license with optional maintenance. Many teams start on Core, and then standardize on XI once they outgrow hand-rolled configs and need centralized administration.
If your priority is granular control, predictable behavior, and a long shelf life, Nagios Core remains a credible alternative to Zabbix. It trades polish for explicitness, but in the hands of a disciplined team, that trade can be an advantage, not a drawback. It thrives in stable environments where change is deliberate, documentation is crucial, and uptime is paramount. Every day.
Icinga

Why it’s a good alternative
Icinga began as a fork of Nagios and has grown into a modern, modular platform that feels lighter to operate than Zabbix. It retains check compatibility while adding a clean web interface, robust REST APIs, and native integrations that reduce glue code.
Key features
- Unified monitoring for hosts, services, networks, and many cloud resources
- Icinga Director for rule-based configuration and dynamic assignments
- Built-in REST API and event stream for automation and integrations
- High-availability clustering and distributed zones for resilient scale
Pros
- Open-source with a polished UI and active development cadence
- Rule-driven config lowers toil in changing environments
- Strong automation story via API, Director, and standard tooling
Cons
- Still benefits from Linux and config-management fluency
- Some advanced modules require planning and careful version alignment
Pricing
Icinga is free under open-source licenses. Commercial support and enterprise modules are available through partners, which helps teams that want a vendor relationship without abandoning the open model.
I like Icinga for teams that appreciate explicit checks but want a smoother operator experience than classic Nagios or a shorter ramp than Zabbix. You get clarity, APIs, and a modern dashboard while keeping the ability to write precisely the checks you need. That combination makes Icinga a pragmatic, future-friendly choice for mixed estates across on-prem and cloud workloads. It scales from small deployments to large, multi-site topologies, and its documentation and community answers smooth over most day-to-day operational questions.
Checkmk
Why it’s a good alternative
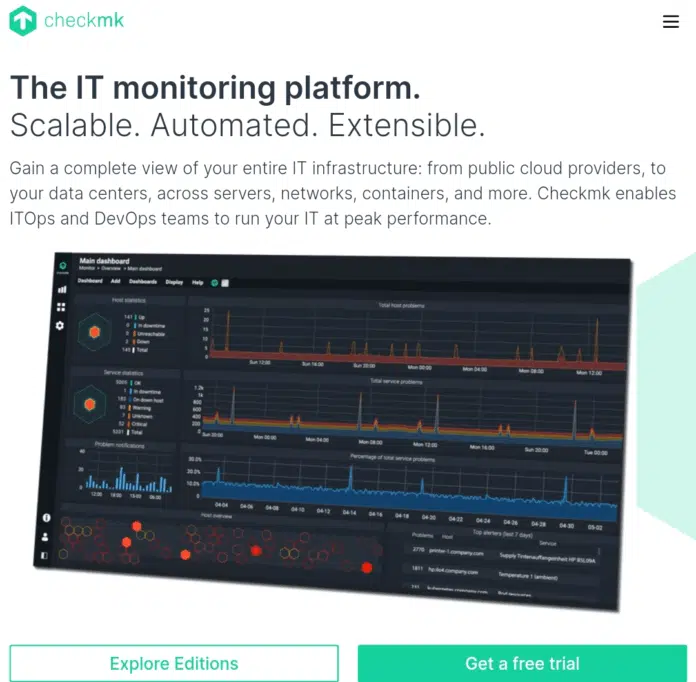
Checkmk emphasizes fast time to value. Unlike Zabbix, initial setup, auto-discovery, and day-two operations feel streamlined. You still get depth, but with opinionated defaults and visual workflows that save hours during rollout and expansion.
Key features
- Agent-based and agentless monitoring with smart auto-discovery and service grouping
- Powerful dashboards, maps, and built-in reporting for capacity and SLA views
- Rule-based configuration that adapts to patterns across hosts and sites
- Distributed monitoring and federation for scale without losing central oversight
Pros
- Quick onboarding; good fit for lean teams that need coverage now
- Strong visualization that shortens investigation time and clarifies status for stakeholders
- Sensible, documented workflows reduce configuration drift and operator error
Cons
- Some integrations and advanced automation live behind enterprise tiers
- Fewer third-party extensions than Nagios-style ecosystems
Pricing
There is a free Raw Edition and a paid Enterprise Edition. Enterprise adds features like advanced reporting, automation hooks, and performance optimizations that matter in larger estates.
I recommend Checkmk when you want Zabbix-level breadth without the same tuning. The auto-discovery, rule engine, and dashboards are easy to standardize, while distributed monitoring supports growth. You trade a little raw flexibility for speed and consistency, which is usually a winning deal when your team is small, your estate is evolving, or leadership wants tangible results quickly. It also plays well with existing ticketing and chat systems via webhooks, keeping alert flow simple and actionable during incidents.
Prometheus
Why it’s a good alternative
Prometheus dominates metrics in cloud-native stacks. If your world includes Kubernetes, microservices, or ephemeral infrastructure, it provides a first-class approach to scraping, storing, and querying time-series data with minimal friction.
Key features
- Pull-based scraping with service discovery for dynamic environments
- PromQL, a rich query language for analysis, alerting, and SLO tracking
- Native integrations with Kubernetes, exporters for standard systems, and Grafana for visualization
- Simple, reliable architecture with local storage and remote-write options for long-term retention
Pros
- Open-source, battle-tested, and cloud-native by design
- Excellent ecosystem of exporters and alerting components (Alertmanager)
- Scales horizontally with sharding and federation patterns
Cons
- Focuses on metrics; logs and traces require additional systems
- Long-term storage and multi-tenancy need external projects or vendor platforms
Pricing
Prometheus is free. Many vendors provide managed Prometheus or compatible backends, which reduces operational overhead while preserving workflows and queries.
Choose Prometheus when your primary need is precise, high-cardinality metrics across services and containers. It pairs naturally with Grafana dashboards and Alertmanager routing and integrates with CI/CD to share alerts alongside deployments. For teams moving beyond static hosts and SNMP-first monitoring, Prometheus delivers speed, clarity, and scale without sacrificing control over data and queries. Traditional network gear is supported via the SNMP exporter, and many vendors now publish native exporters, closing gaps that once required custom scripts or parallel tooling. It helps maintain a consistent system structure and eliminates switching back and forth between multiple dashboards.
PRTG Network Monitor
Why it’s a good alternative
PRTG Network Monitor focuses on usability. If Zabbix feels heavy, PRTG’s sensor-based model, auto-discovery, and polished dashboards make coverage and reporting straightforward for mixed Windows, Linux, and network estates.
Key features
- Prebuilt sensors for SNMP, WMI, NetFlow, HTTP, databases, and cloud services
- Intuitive maps, dashboards, and mobile apps for fast situational awareness
- Flexible alerting with dependencies, schedules, and multi-channel notifications
- Cluster failover and remote probes for distributed sites and MSP scenarios
Pros
- Minimal ramp time; strong fit for small and midsize teams
- Visual tooling accelerates rollout and reduces operator error
- Broad protocol support without heavy scripting
Cons
- Licensing by sensor can increase costs in vast environments
- Less attractive for teams that insist on open-source tooling
Pricing
PRTG includes a free tier with 100 sensors. Paid licenses scale by sensor count and include maintenance and support, which many organizations prefer budgeting for unknowns.
Choose PRTG when you want fast value, clean visuals, and reliable SNMP and flow monitoring without deep tuning. Its remote probes simplify branch monitoring, and the dependency logic cuts alert storms during upstream outages. PRTG is a practical, seamless alternative to Zabbix’s more configuration-heavy approach for IT groups that need results this quarter. Reporting is equally accessible: executives get trend lines and SLA views out of the box, while engineers can drill into interfaces, sensors, and historical baselines to validate fixes and plan capacity. The learning curve stays simple even as coverage expands.
Datadog
Why it’s a good alternative
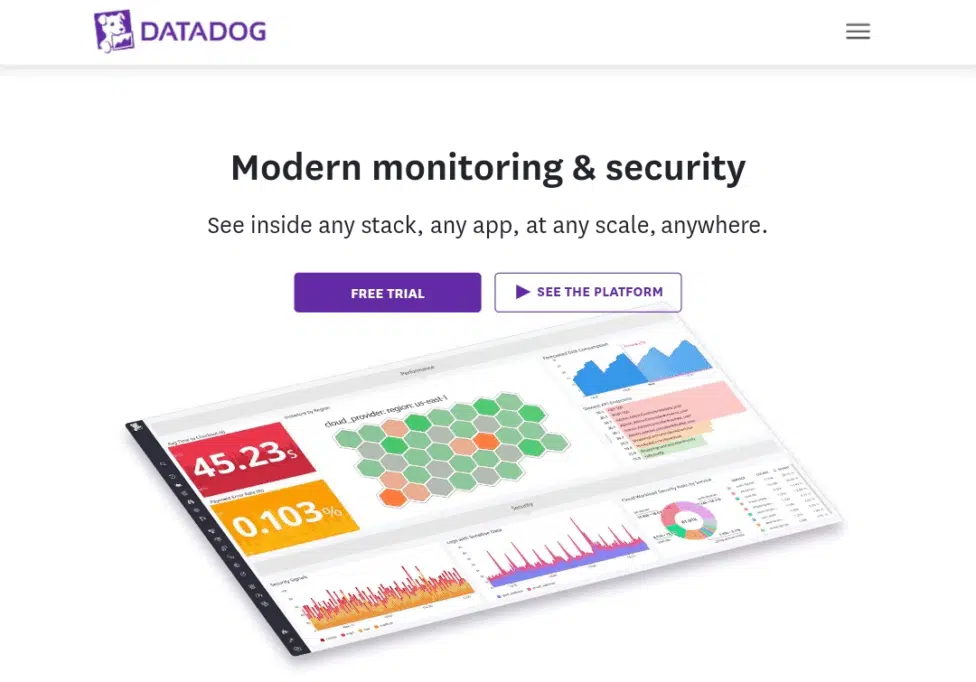
Datadog delivers full-stack, SaaS-based observability. If you want Zabbix-level breadth without running databases and collectors yourself, Datadog’s agents and integrations provide fast coverage across hosts, containers, cloud services, applications, and network devices.
Key features
- 500+ integrations spanning infrastructure, APM, logs, RUM, synthetics, and security
- Autodiscovery for containers and cloud resources; unified tagging across telemetry types
- Modern dashboards with notebooks, topology maps, and service overviews
- AI-assisted anomaly detection and alerting to reduce noise
Pros
- Rapid rollout and minimal maintenance burden for lean teams
- Single pane for infra, apps, logs, and user experience
- Firm support, docs, and onboarding flows
Cons
- Usage-based pricing can climb with scale and data retention
- Requires internet connectivity and trust in a third-party platform
Pricing
Pricing is modular by product (infrastructure, APM, logs, etc.) and typically billed per host or volume. That flexibility is helpful, but model costs carefully to avoid surprises as adoption grows.
Pick Datadog if your priority is speed, coverage, and collaboration. Dashboards and notebooks make shared investigation natural, and unified tags keep context intact across alerts. For hybrid estates, Datadog reduces tool sprawl and provides leaders, SREs, and network engineers with a unified view without requiring significant effort on their part. Network monitoring is also first-class: flow logs, device health, path analysis, and SNMP polling are integrated into the same views as servers and services, thereby tightening feedback loops during incidents and changes. This coherence is significant. Speeds triage and reduces handoffs between specialized teams.
FAQs
Is Zabbix still worth using?
- Yes. Zabbix remains excellent if you have expertise, need fine-grained control, and prefer self-hosted monitoring. Evaluate alternatives only if setup time and operational load are pain points.
Which Zabbix alternative is easiest to deploy?
- PRTG and Checkmk are quickest for traditional networks. Datadog is the fastest end-to-end if you want managed SaaS and unified dashboards without running infrastructure.
What’s best for cloud-native and Kubernetes?
- Prometheus leads for metrics, paired with Grafana for visualization and Alertmanager for routing. Datadog is strong if you want metrics, logs, and APM together as a service.
Can I monitor classic network gear without Zabbix?
- Absolutely. PRTG, Checkmk, Nagios Core, and Icinga support SNMP, flow data, and health checks. Prometheus supports devices via the SNMP exporter.
How should I plan a migration from Zabbix?
- Inventory what you monitor, map alert policies to equivalents, and pilot one segment first. Keep Zabbix running in parallel until coverage, noise levels, and reports match expectations.
Will costs go up or down?
- It depends. Open-source tools reduce licensing costs but require additional engineering time. SaaS reduces administrative work while scaling with usage. Model scenarios across three years to compare ownership costs.
Conclusion
Testing these tools confirmed that “best” alternatives depend on context.
Nagios Core and Icinga deliver if you want open-source control with explicit checks. If you need fast rollout and friendly dashboards, Checkmk and PRTG save time. If your stack is cloud-native, Prometheus is the obvious core. If you want managed breadth with minimal administration, Datadog shortens the path to visibility.
Pick the platform that reduces toil for your team, proves value fast, and scales without drama. That is how monitoring stays useful, not burdensome. Your future incidents will be shorter, calmer, and easier to learn from.

